Advisory about upgrading to Mac OS X Lion

The next Mac operating system, OS X 10.7 “Lion”, is scheduled to be released this month. “When should I upgrade?” is the hot question for users of FileMaker Pro and FileMaker Server.

The short answer: We strongly recommend waiting to upgrade to Lion. There are known issues and potential problem points, regardless of your current version of FileMaker. For our clients whose solutions we host, we will conduct solution-specific tests before giving the green light on upgrading. Please delay upgrading until we have completed our internal testing.

One major change with Lion is that the compatibility software “Rosetta” will no longer be part of the Mac operating system. This means

Read More

Charting in FileMaker Go for iPad — what’s new in v2

Charting with FileMaker Go on the iPadWeb technologies have added functionality to FileMaker solutions since the Web Viewer layout object was introduced in version 8.5. The web viewer has proven especially useful for displaying Flash-generated charts from FusionCharts, Maani, AnyChart, and others.

FileMaker Pro v11 introduced a built-in chart layout object with 5 basic chart types. Charts suddenly became much easier to implement in FileMaker Pro!

However, with FileMaker Go for iPad and Phone (separate apps) built-in charting is not supported and Apple’s iOS doesn’t run Adobe Flash. The Google Charts API is popular, but for that you must be online.

Luckily, the potential of HTML5 for charting is huge, and the spec that affects charting functions (via the canvas tag) is fairly stable.

Read More

Fun with FileMaker Pro 11 Charts, v1.5

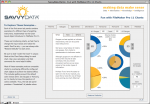
Knowing how to represent data visually often draws upon quite varied skills. A data visualist ideally possesses some of the traits of information architect, graphic designer, mathematician, statistician, web designer, teacher, user interface designer, cognitive psychologist, and storyteller. One could argue that these skills are essential to thriving in our future information-rich society. Until the future arrives, however, we must manage with whatever we have. And one thing we now have is FileMaker Pro 11 Charts! Charting is the feature that will drive a new stage of success.

The demo file explores using the chart object in new ways…

Read More

Sparklines with FMP11 Charts – Updated

Reposted with updated file — Sparklines demo is more interactive, with informative dynamic tooltips.

Download link for the demo file: SavvyData_ChartFun.fp7.zip

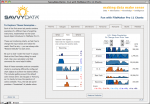
Sparklines are “data-intense, design-simple, word-sized graphics,” as their inventor Edward Tufte describes them in his book Beautiful Evidence. Due to their form and format, sparklines are most appropriate on lists and subsummary reports, and are well suited to

Read More

Bar Charts on Steroids

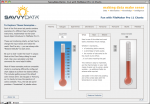
The bullet graph is a horizontal bar chart on steroids. This device was invented in 2005 by Stephen Few of Perceptual Edge, as a response to dashboard widgets that take lots of screen space to provide one piece of information.

By contrast, the bullet graph can efficiently convey quantitative data such as goal & percent attainment, as well as qualitative measures such as how good or bad a score of “85” really is. The unusual aspect to this is

Read More

Chart Palettes Cheatsheet for FMP11

Last week FileMaker Inc. announced FileMaker Pro 11 — and most early reviewers agree the most exciting new capability is charting. In the weeks to come I’ll be digging in and providing demo files for some cool uses of this important new tool.

If you already chart in FusionCharts or xmChart or 360Works Charts or AnyChart or xmChart or Maani or Google API or SimpleChart or [your unnamed favorite here], you will still find the built-in chart tool easier to use than any of those. It is amazingly convenient. And did I mention easy? If you’re not a charting fan yet, then I’m sure you soon will be.

That said, this IS the first version with charting built-in, so it would be good to keep expectations modest.

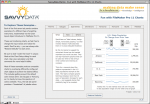
For example, FileMaker Pro 11 Chart automatically assign colors to the Y-axis data series/elements from a choice of 20 palettes. Unlike the advanced third-party charting options, you cannot assign a specific color to a particular data point.

However there are ways to get around the default color choices

Read More