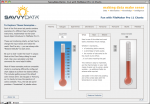
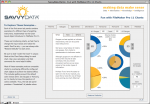
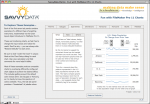
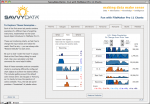
Knowing how to represent data visually often draws upon quite varied skills. A data visualist ideally possesses some of the traits of information architect, graphic designer, mathematician, statistician, web designer, teacher, user interface designer, cognitive psychologist, and storyteller. One could argue that these skills are essential to thriving in our future information-rich society. Until the future arrives, however, we must manage with whatever we have. And one thing we now have is FileMaker Pro 11 Charts! Charting is the feature that will drive a new stage of success.
The demo file explores using the chart object in new ways…
